Diabetes is a metabolic disease consequent to a decrease of insulin activity, which may be due to a reduced availability of this hormone (type 1 diabetes or insulin-dependent diabetes [IDD]), to an impediment to its normal action or to combination of these two factors (type 2 diabetes or non-insulin-dependent diabetes [NIDDM]).
Hyperglycaemia is the main characteristic of diabetes. With time, it can lead to vascular and nervous alterations: macro-angiopathy (a severe and early atherosclerosis) and micro-angiopathy (alterations of small arteries that affect the retina particularly, the kidney and the nervous tissue) are the most important ones.
Diabetic retinopathy (DR) is a serious and frequent complication of diabetes, resulting from damage to the retinal microvasculature. Several factors contribute to the development of DR, the main one is that chronic hyperglycaemia causes an overproduction of superoxide anion and reactive oxygen species (ROS) and, consequently, it causes the depletion of antioxidant systems. This would lead to the activation of the four main pathways involved in the development of DR: the polyol pathway, the path of hexosamine, the way of diacylglycerol-PKC (protein kinase C) and the way of advanced glycation end-products (AGEs). Hyperglycaemia is the initial cause of tissue damage in terms of diabetes. Retinal cells involved in DR are vascular cells – both neuronal and glial. In neurons there is a greater uptake of glucose through the glucose transporter 1 (GLUT1) and sodium-dependent glucose co-transporter (SGLT) channels. The sum of the changes to these cell populations then results in different degrees of retinopathy.
The initial form of DR, known as ‘non-proliferative’ (NPDR), is characterised by aneurysms, i.e. the ‘breaking’ of the thin capillaries that nourish the retina, causing retinal haemorrhages. The advancedform of DR is known as ‘proliferative’ (PDR), where the formation of capillaries occurs in a totally anarchic way (neovascularisation), and the rupture of those form scars, which can lead to a retinal detachment. Unfortunately, eye symptoms of DR occur when the disease is in an advanced stage and has already caused irreversible damage. They are represented by a slow and gradual diminishing of visual acuity associated with a distortion of the images (metamorphopsia) or by a sudden loss of vision in an eye for an extensive haemorrhage or occlusion of a large vessel.
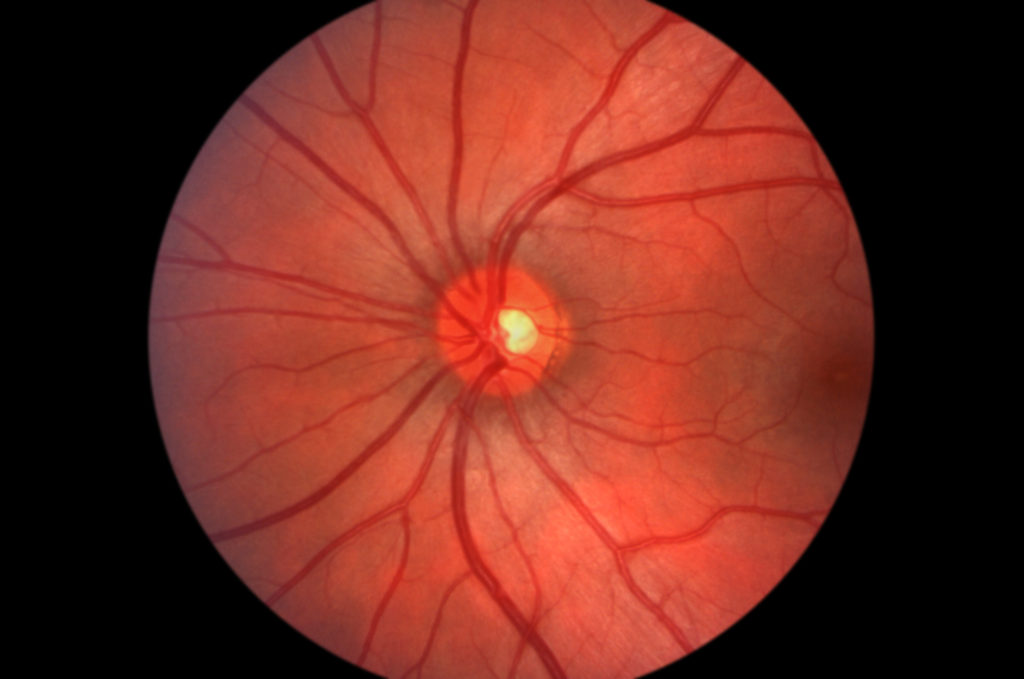
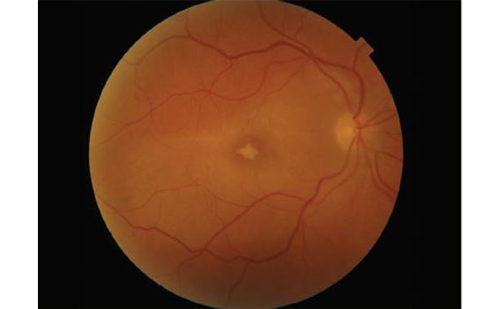
Currently, the diagnosis of DR requires an eye examination with a careful fundus examination and photography with a non-mydriatic fundus camera that documents the current state of the retina allowing a better follow up. Sometimes an optical coherence tomography (OCT) examination (macular oedema) or a fluorescein angiography (diagnostic classification and planning of a laser treatment) are required. Despite the fact that visual impairment due to DR is often late and occurs when the anatomical damage is already irreversible, several studies have shown the sensitivity of psychophysical methods to identify signs of the disease already in the preclinical phase.
Epidemiological Notes
Retinopathy occurs in about 85 % of diabetic patients and, over time, can lead, in a significant percentage of cases, to the complete loss of vision, representing the most common cause of blindness among working-age people in the developed world (data from the International Diabetes Federation).1
Many risk factors can influence the incidence and prevalence of DR. It is well-established that both the risk of developing a DR and adiabetic macular oedema (DMO) increase with the duration of diabetes. Other co-factors are hypertension, hyperglycaemia, dyslipidaemia, pregnancy, puberty, cigarette smoking, cataract surgery, obesity and poor glycaemic control.2
The largest number of epidemiological data regarding this disease derives from large studies such as the Wisconsin Epidemiologic Study of Diabetic Retinopathy (WESDR), the Diabetes Control and Complications Trial (DCCT), the UK Prospective Diabetes Study (UKPDS) and the Early Treatment Diabetic Retinopathy Study (ETDRS) even if they have been very heterogeneous in terms subject selection and inclusion criteria such as age, ethnicity, comorbidities and DR stage.3
Currently, worldwide there are about 366 million people with diabetes and this number is expected to increase due to the ageing of the world population, urbanisation and obesity (see Figure 1). A recent systematic review of 35 population-based studies showed that the prevalence of various forms of DR in individuals with diabetes is 34.6 % for NPDR, 7.0 % for PDR, 6.8 % for DMO and 10.2 % for vision-threatening DR (VTDR).4
It is estimated that the number of people with DR will increase from 126.6 million in 2011 to 191 million by 2030 and the number of people with VTDR will increase from 37.3 to 56.3 million. The National Health and Nutrition Examination Survey (NHANES) study (2005–2008) showed that about the 28.5 % of people with diabetes in the US have some degree of DR, 4.4 % have VTDR5 and similar data are deduced in other industrialised countries. In China, it is estimated that today 92.4 million adults have diabetes and that 43 % of them have retinopathy (6.3 % have VTDR).6 The WESDR (1984) made the major contribution to research data on the prevalence of retinopathy in the US. The main results were that the overall incidence of DR in a 10-year interval (from 1980/1982 to 1990/1992) was about 74 %, and among those with DR at baseline, 64 % developed some severe form of retinopathy and 17 % underwent the proliferating type.7 The incidence was higher in patients with a long history of diabetes and in those who started late the insulin therapy. In a 25-year follow-up group with IDD, almost all patients (97 %) developed DR, 42 % progressed to PDR and 29 % developed macular oedema with an annual incidence rate of 2.3 %, 2.1 %, 2.3 %, and 0.9 % in the first, second, third, and fourth term follow up, respectively.8,9
Recently,10 the impact of DR on the quality of life has been evaluated using a questionnaire, the EQ-5D MAUI , which refers to five dimensions (indicators of physical and mental health): mobility, self-care, daily activities, pain/discomfort and anxiety/depression. The study involved 577 people, most of them were males with NIDD. Patients with retinopathy had consistently lower scores on the EQ-5D test than those who had no signs of retinal impairment. Therefore, visual impairment impacted negatively on the quality of life, especially when combined with other complications of diabetes (nephropathy, neuropathy, heart disease, etc.)
The Psychophysical Evaluation
Several psychophysical tests, such as examination of contrast sensitivity, microperimetry and the tests of colour perception, have been successfully used in the evaluation of the visual function of patients with DR.
Contrast Sensitivity Tests
The visual function that seems to be affected first by DR is contrast sensitivity. It is defined as a measure of the amount of contrast between light and dark (monochrome or colour) required to detect or recognise a unique visual target.11 Most of the visual tasks that people are encounter daily, require the detection of objects with low contrast. This test, therefore, correlates better than visual acuity (examined with traditional optotypes ) to the real visual function.12,13 Furthermore it has the advantage of being easy and quick to perform, inexpensive and relatively reproducible.14
The tests of visual acuity are still valid for the evaluation of refractive defects while it is now clear that many eye diseases, including glaucoma and, indeed, DR, do not affect the ability to discriminate the details (especially in the early stages), but rather other characteristics of visual function. The instruments used to determine it are differentiated by the type of object presented, which can be of two types: a sinusoidal pattern or letters (or characters). A simple example of contrast sensitivity examination is the Pelli-Robson chart (see Figure 2).
Contrast sensitivity is presented as a curve (see Figure 3), which plots the lowest contrast level a patient can detect a specific size target. The x-axis of the curve is for spatial frequency; the y-axis is for contrast sensitivity. Low spatial frequencies are large gratings and high spatial frequencies are thin gratings. Contrast sensitivity is the inverse of contrast level. The higher the contrast sensitivity, the lower the contrast level at which the patient can detect a target. In normal subjects, the threshold of maximum sensitivity is located towards 3.5 cycles/degree (C/°). Furthermore, in low light conditions, the threshold tends to increase, while in conditions of high illumination it tends to lower. Contrast sensitivity can be measured at various spatial frequencies. The examination with contrast variables for different spatial frequencies provides a more complete assessment of the discriminative ability of the human eye.
It is also known as the contrast affects other visual characteristics, such as the perception of colours, and, especially, that it seems to be reduced with the decrease of the apparent velocity of an object. Although both the discrimination of colours and the contrast sensitivity reflect the macular function, their exact physiological relationship is not yet fully understood.
Trick et al.15 compared the capacity for these two parameters to identifying the early visual dysfunction in patients with diabetes. They found that 37.8 % of subjects without retinopathy had abnormalities in both tests. That rate rises to 60 % in terms of people with retinopathy. Contrast sensitivity is most frequently abnormal then colour discrimination (100 hue test) and rarely individual’s deficit of contrast sensitivity and colour vision is simultaneous.
Brinchmann-Hansen et al.16 also found that contrast sensitivity is more closely related to the degree of retinopathy compared with colour vision. Misra et al.13 found a statistically significant relationship between contrast sensitivity and visual acuity (expressed in LogMAR) and between it and blood levels of glycated haemoglobin (HbA1c). This test on patients with diabetes was altered even when the OCT, the fundus photography and the visual acuity were absolutely in the norm.17 Significant loss of contrast sensitivity was observed in patients with IDD who had no evidence of retinopathy compared with controls without diabetes18–21 particularly at medium–high spatial frequencies. This is probably due to structural and functional changes in foveal and parafoveal regions caused by different mechanisms, such as dilation of the capillaries (with their possible obliteration and tortuosity) and relative retinal thickening.22 Loukovaara and collaborators,23 on the contrary, evaluating retinal thickness in women with gestational diabetes and relating it to the contrast sensitivity, showed an increase in retinal thickness and a reduction of sensitivity. Even adolescents, with a relatively short history of IDD, already showed the first signs of a deficit in contrast sensitivity.24
That examination was also used for the evaluation of vision after a pan-retinal laser treatment that often allows to stop, at least, the progression of visual impairment. After the laser treatment, both visual acuity and contrast sensitivity appeared better when comparing with untreated eyes.25 In subsequent work, the stabilisation of visual acuity after treatment seemed to be accompanied by an improvement in contrast sensitivity.26
Perimetry and Microperimetry
During normal visual activity, the eye never remains completely still, but while setting a target, it makes small involuntary and targeted movements. The removal of these movements would cause the disappearance of our perception of a stationary target. However, the excessive instability reduces the spatial resolution and can interfere heavily with the visual performance in everyday tasks, such as reading. All ocular pathologies that affect the central vision alter, more or less extensively, the fixation, one of the most important features for an optimal visual function. Like all maculopathies, DR also affect this capacity (see Figure 4).
Al Shafaee et al.27 demonstrated a significant loss of macular function on the eyes of patients with pre-diabetes, supporting the hypothesis that neurodegeneration precedes microangiopathy. The Micro-Perimeter perimeter (MP-1) (Nidek Technologies, Padova, Italy) has proved a useful tool to quantify retinal sensitivity in patients with DR allowing the detection of the early loss of retinal sensitivity in patients with diabetes even without clinical evidence of retinopathy.28 Dunbar et al.29 found no significant difference between the scanning laser ophthalmoscope (SLO) and the MP-1 comparing them between 16 control subjects and 21 patients with diabetic maculopathy. Patients with severe PDR, moreover, showed a strongly reduced retinal sensitivity than those with lower stages of DR.30 In particular, the retinal areas affected by exudative phenomena had greater alterations.31 The position and the stability of fixation, in patients with diabetic macular oedema, seems to be independent from the characteristics of oedema, but subfoveal hard exudates have a particularly negative effect on these parameters.32 Visual acuity, retinal sensitivity, central foveal thickness, duration of symptoms, blood levels of HbA1c and the presence of cystoid macular oedema were strongly associated with the impairment of fixation in patients with NIDD and vision-threatening macular oedema.33 In addition, less-sophisticated perimetric techniques such as the whiteon- white perimetry34,35 and frequency-doubling technology (FDT)36 have been used with success and with similar results.
Colour Sensitivity Tests
Being a predominantly macular function, colour perception may be compromised by any degenerative process that affects the retina.37 The underlying mechanism is still largely unknown and may refer to a metabolic imbalance of the retina rather than a microvascular impairment.38 Several tests are available to assess the colour vision but the results can be influenced by the presence of lens opacity or by genetic defects of colour discrimination.39,40 One of the most widely used tests, together with Ishiara’s plates, is Farnsworth-Munsell’s 100 hue test.41 In a study of young patients with IDD,42 this test has proved to be relatively more sensitive and specific in detecting visual dysfunction compared with the electroretinogram. Most of the results confirm that a significant deterioration of colour vision (mainly evaluated by the test of Farnsworth-Munsell) occurs in patients with diabetes without retinopathy compared with non-diabetic controls.43 More specifically, the sensitivity to yellow–blue frequencies seems to be more affected.44,45 Some authors believe that this alteration is due to a loss of yellow– blue sensitive cones (S-cones),46,47 while Knowles et al.48 and Tregear et al.49 suggested that at the basis of this defect of colour perception is essentially the browning of the lens. The colour perception, in fact, improved in subjects operated of phacoemulsification and implantation of intra-ocular lens (IOL) with blue light filter.50
In 1998, Mahon and colleagues51 concluded that untreated eyes with proliferative retinopathy had deficits in the discrimination of hue more pronounced then light sensitivity. The laser treatment (pan-retinal photocoagulation [PRP]), according to the authors, seemed to produce a paradoxical normalisation of the perception of light (saturation) but a still impaired chromatic sensitivity.
Ong et al.52 argued that the assessment of colour perception is even more sensitive and specific of fundus photography in the detection of DR with visual impairment. The same authors, in a previous work,53 concluded that this test, for the screening of DR, in the more sensitive for the assessment of visual acuity.
Conclusions
It is evident that diabetes deeply involves the psychophysical aspects of visual function. Colour perception and contrast sensitivity, in particular, seem to be the functions that are mainly compromised, even before the visual acuity. They are impaired before structural retinal abnormalities can be detected through ophthalmoscopy or fluorangiography. Moreover those exams are inexpensive, reproducible, non-invasive and affordable for any eye clinic. We need to escalate the use of these diagnostic methods in everyday clinical practice to improve our approach to patient care and, above all, to achieve a secondary prevention (screening) itself. Microperimetry, moreover, is not only useful for visual rehabilitation but, as we have seen, in the early diagnosis of various retinal diseases too, including DR.


